Expendable, miniature, low-cost turbojet engines are often equipped with axial turbines. These turbines usually have a low-pressure ratio, a simple design of the blades and vanes, and a relatively low performance.
In this article, we show that the main turbine characteristics, such as efficiency and exit flow angle, can be sufficiently improved using parametric optimization.
Using a fast code for mean-line turbine design in modeFRONTIER’s optimization environment allowed us to check about two million configurations and to determine the most important design parameters.
Read the article
CASE STUDY
This technical article, a collaboration between EnginSoft and ZECO, compares two different methodologies for the study and optimization of impulse turbines, specifically Pelton turbines, in order to evaluate which is the quicker and more reliable method.
cfd particleworks energy
CASE STUDY
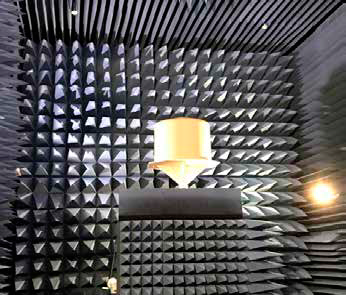
Elettronica SpA designs and produces systems for electronic warfare. Each system design is unique according to its platform and purpose. In this article, the company describes how it used CAE to approach the challenging design of a single sandwich radome.
ansys optimization electronics