Expertise | Automotive

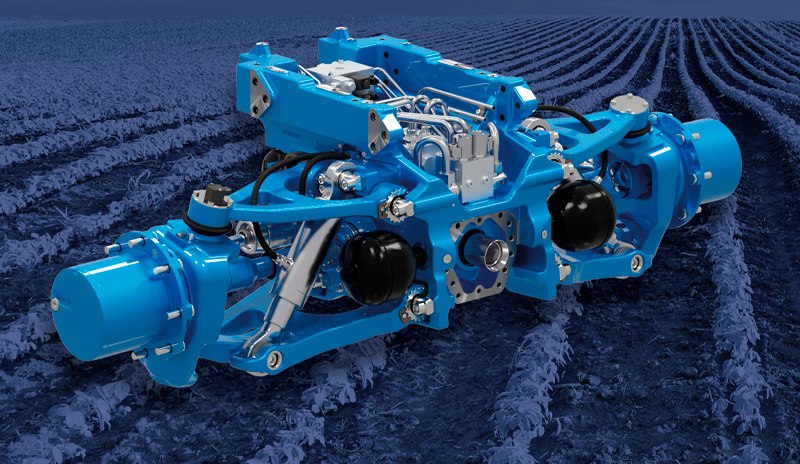
Powering the next generation of off-highway suspension design

Design process integration of an independent suspension axle for off-highway vehicles

Newsletter EnginSoft Year 18 n°2
By Alessandro Benevelli and Federico Bavaresco | DANA Incorporated
Andrea Fornaciari | University of Modena and Reggio Emilia

Alessandro Benevelli is a System Solution Engineer at Dana Incorporated (in Reggio Emilia, Italy) and Federico Bavaresco is an Axle Lead Engineer at Dana Incorporated (in Arco, Italy).

Dana Off-Highway Drive and Motion Systems

Abstract

This study presents the work undertaken by Dana Incorporated to develop a new independent suspension axle for an off-highway vehicle (OHV). This multi-disciplinary simulation activity combines improvements to the kinematic and dynamic performance of the suspension while also examining the constraints of the mechanical design and the hydraulic system, as well as the cost of the suspension.

The primary goal of this study was to assess the capabilities of an automated optimization process developed using design optimization software “modeFRONTIER” which integrated several tools including Creo®, MSC Adams®, and Simcenter Amesim®. This project also served to assist Dana in successfully integrating this methodology into future workflow process enhancing independent suspension axles.

An “independent suspension” is any vehicle suspension system that allows each wheel on the same axle to move vertically, independently of the others — for example when reacting to a bump on the road. Compare this to a rigid or beam axle system in which the wheels are linked and movement on one side also affects the wheel on the other side.
Independent suspension typically offers better ride quality, traction, and handling characteristics in both automotive and off-highway vehicles. On the other hand, this kind of suspension system requires additional engineering effort and is more expensive to develop than a rigid axle.
Among these systems, hydro-pneumatic suspensions are particularly important for OHVs. One of the main reasons for this is the hydraulic system’s ability to work better with heavy loads in a limited space compared to mechanical systems. In addition, because the gas functions as an adjustable spring, the viscous friction within the hydraulic fluid is harnessed to be the damping function of the system.
This improves the ability to respond to system oscillations. Finally, a well-designed hydraulic system allows the suspension not only to adjust stiffness and damping, but also to adjust vehicle levelling and to choose between different working conditions (e.g., field or road maneuvers).
The design of this type of system involves integrating the hydraulics with the mechanical structure of the suspension, which in this case is a double wishbone suspension (see Fig. 2). This is a complicated, multi-disciplinary activity. In fact, it is necessary to combine the ideal improvements of the kinematic characteristics and the dynamic behaviour of the suspension with design constraints due to both the overall dimensions and the hydraulic system.
For this reason, a non-automated design process tends to be primarily based on experience and an iterative approach. The purpose of this activity, therefore, was to create a method for automating a multi-objective optimization process for an independent suspension design.

Use of modeFRONTIER allowed Dana to develop this automated process by integrating several spreadsheets and CAE tools necessary for the optimization itself. For example, an Excel spreadsheet and various MSC Adams simulations were needed to evaluate the suspension’s kinematics and its dynamic effects on the vehicle, while Simcenter Amesim simulations were used to correctly size the hydraulic system. Some CAD models developed in Creo were also integrated into the process. As mentioned, they were used to ensure that no static or dynamic interference appeared in the optimized solutions.
In addition, the modeFRONTIER workflow development enabled a better understanding of the influence of certain parameters and on the overall simulation results. The results were then investigated further to identify the best solutions in terms of performance, feasibility and cost.

The starting point for the MSC Adams and Creo models was a spreadsheet that defined the hardpoints of the suspension structure and some anti-characteristics of the system. As mentioned, many MSC Adams simulations were required to consider all the kinematic and dynamic aspects of the suspension.

  • Suspension kinematics testing, i.e., parallel wheel displacement, opposite wheel displacement, and steering displacement. These simulations were necessary to evaluate the kinematic characteristics and behavior of the suspension architecture.
  • Modal analysis of the vehicle, which generated knowledge of the first natural frequency and the ideal stiffness and damping values for the vehicle system at different workload conditions (e.g., unladen vehicle weight, gross vehicle weight, etc.).
  • Dynamic performance simulations, necessary to measure the comfort, handling, and traction performance of the vehicle. These were obtained by performing: ISO5008 simulations at different vehicle speeds; ramp steering and moose test simulations; and traction tests on a 4-poster test bench.

Most of the objective functions of the optimization were outputs of these simulations, such as selected kinematic characteristics of the suspension or the dynamic performance in terms of comfort, handling, and traction. Some other outputs, however, served as inputs to other models.
For example, ideal stiffness and damping values from the Adams modal analysis were considered as inputs for hydraulic circuit sizing in Simcenter Amesim. At the same time, the actual stiffness and damping force curves were evaluated in the hydraulic circuit sizing and were inputs for the dynamic simulations in Adams.

The static loads on the suspension actuators and the corresponding ideal stiffness and damping values were inputs to the sizing of the hydraulic circuit. The circuit was then sized to support these loads and achieve the target stiffness and damping values. In addition, it was sized so that the overall dimensions and cost met the targets. The main parameters to be considered were the dimensions of the hydraulic actuators, the dimensions of the hydro-pneumatic accumulators, and the damping valves and/or orifices. The correct working pressure range also had to be verified. To do this, a spreadsheet and some Amesim templates were deployed. In particular, an Excel sheet was exploited to size the stiffness part of the circuit while the Simcenter Amesim models were used to set the dimensions of the damping valves and/or the dimensions of the orifices.
These models were also used to evaluate the actual stiffness and damping force curves, which are different from the ideal ones identified in the modal analysis. These curves were needed by the Adams dynamic simulations to consider the actual behavior of the suspension system.

The optimization process required control so that there was no static and dynamic interference between the individual mechanical parts and the elements of the hydraulic circuit. It was therefore necessary to integrate two simplified 3D CAD models developed in Creo, one for static and one for dynamic interference.
The input parameters of these models were the coordinates of the structure’s hardpoints, the overall dimensions of the hydraulic circuit elements, and the maximum vertical and steering displacement of the suspension. This ensured the feasibility of the solution in each suspension configuration.

Fig. 4 - Simplified CREO model for evaluating interferences

Fig. 5 - First concept of the optimization workflow

The first concept of the optimization workflow illustrated in Fig. 5 was characterized by a large number of input variables and objectives.
This resulted in a significant number of designs being evaluated in the optimization stage to obtain reliable and accurate results. In addition, each simulation model had to be run for each design, and some of these simulations were quite long, which would have made the process inefficient.
Therefore, we decided to split the workflow into three cycles or loops, each of which had fewer input variables, fewer objectives, and thus fewer designs to evaluate than the initial workflow. As shown in Fig. 6, each loop represented the optimization of some aspect of the entire system.
This was possible because some of these aspects were independent of each other, while we used the optimized outputs from previous loops as inputs for the dependent aspects. Finally, the workflow was structured to clearly describe the method of investigating the phenomena and to manage the strategic analysis more easily.

Fig. 6 - Workflow split into three loops

Loop 1

Loop 1 was used to define the kinematics of the suspension, hence the structure of the hardpoint positions that influence the main kinematic parameters. The objective of this loop was to find the best architectural solution that would guarantee the best kinematic characteristics of the suspension, while ensuring that there was no mechanical interference.
The design parameters for Loop 1 were as follows:

  • Input variables - 23 variables between independent hardpoint coordinates and kinematic requirements.
  • Output variables - dependent hardpoint coordinates, kinematic characteristics, steady-state roll stability factor, and possible interference.
  • Objective functions - minimization of camber loss and maximization of roll stability factor.

These objectives were chosen after a sensitivity analysis. Other objectives suggested in the first optimization concept were turned into constraints:

  • constraints - kinematic features have minimum values and no static/dynamic interference.

The workflow concept for Loop 1 is illustrated in Fig. 7.

Fig. 7 - Loop 1 workflow

Loop 2

The block diagram of Loop 2’s workflow is shown in Fig. 8. The goal was to define both some remaining hardpoint locations and the suspension stiffness and damping in order to minimize the first natural frequency of the system.
The optimized coordinates from Loop 1 were held constant while the hardpoints affecting the vehicle’s anti-dive were set as variables. This is because the anti-dive value affected the modal analysis of the vehicle. The modal analysis was repeated in the workflow for different load conditions.
In addition, a nested optimization of the hydraulic circuit sizing was integrated with the information from the Adams modal analysis (i.e., static cylinder loads and corresponding stiffness values). This loop focused on the stiffness aspect of the circuit while the damping aspect was studied in Loop 3.

Figs. 8 - Loop 2 workflow

The design parameters of Loop 2 are described below:

MAIN

  • Input variables - 23 variables including independent hardpoint coordinates, suspension anti-characteristics, stiffness, and damping values.
  • Output variables - dependent hardpoint coordinates, modal analysis results.
  • Objective functions - minimization of the first eigenmode frequencies. The first natural frequency should be as low as possible, while not descending below the motion sickness value (about 1 Hz).
  • Constraints - kinematics have minimum values, motion sickness, absence of interference.

NESTED

  • Input variables - 12 variables between hydraulic circuit parameters and input of constants from the modal analysis.
  • Output variables - min/max effective suspension stiffness for each load condition, min/max levelling pressure for each load condition, penalty function, cylinder footprint, effective stiffness force curves.
  • Objective functions - penalty function minimization, footprint and cost minimization. The penalty function was defined to reach 0 when all stiffness requirements are met. The lower the value of the penalty function value, the better the solution.
  • Constraints — achieving the most important stiffness values.
Fig. 9 - Loop 3 workflow

Loop 3

The optimization goal for Loop 3 was the definition of the suspension’s damping requirements. The minimum and maximum damping coefficients found in the Loop 2 modal analysis were the starting points for this optimization. This workflow was divided in two sub-optimizations, a valve pre-selection and a dynamics optimization.
The first was aimed at continuous sizing of the damping part of the hydraulic circuit and subsequent selection of the most suitable valves from a portfolio. Starting from these best valves, the goal of the second sub-optimization was to improve the dynamic performance in terms of comfort, handling, and traction. The variable parameters were the input current to the damping valves, which define the damping of the entire system. Every other parameter was taken from the previous loops and set as a constant.
The design parameters for Loop 3 were:

OPT.1 – Valve pre-selection

  • Input variables - 12 variables between hydraulic circuit parameters and input of constants from the modal analysis.
  • Output variables - list of best damping valves.
  • Objective functions - minimization of hydraulic circuit size and cost.
  • Constraints - achieving the min/max damping coefficients.

OPT.2 — Dynamic optimization

  • Input variables - valve index, valve input currents.
  • Output variables - effective damping force curves, Adams dynamic simulation results.
  • Objective functions - minimization of whole-body vibration (comfort), maximization of roll stability factor (handling), maximization of total contact factor (traction).
  • Constraints - no constraints.

Each of the three dynamic simulations in Opt.2 (i.e., comfort, handling, and traction) had a dedicated project node with a nested optimization.
This made it possible to evaluate the corresponding best valve current, and hence damping value, for the three different aspects. The conceptual workflow for Loop 3 is shown in Fig. 9.

Each loop presented in the previous section required a multi-objective optimization approach since there was more than one objective function per loop.
Due to the large number of input variables, the optimization strategy required a robust optimization followed by an accurate one.
modeFRONTIER enabled each best-solution cluster to be identified with the first step, while refining the best values more accurately with the second.
Regarding Loop 1, an NSGA-II controlled system algorithm was selected for the robust optimization and an NSGA-II variation population size for the accurate one. The DOE of the first robust optimization was created in modeFRONTIER starting from the lower and upper bounds of the input variables and using the Incremental Space Filler and Uniform Latin Hypercube algorithm.
In contrast, the DOE of the second and accurate optimization was the set of best designs from the robust optimization.
As Fig. 10 shows, the reference design was far from the Pareto frontier. This implies that one or more better solutions in terms of kinematic characteristics could easily be found among the analysed ones. With more than one best solution available, it is up to the user to choose which direction to take regarding the Pareto frontier.
Almost the same optimization strategy was chosen for Loop 2, both for the main and the nested workflows (i.e., an NSGA-II controlled system for the robust optimization, an NSGA-II variation population size for the accurate optimization). The creation of the Loop 2 DOE was also similar to the previous loops.
Fig. 11 shows the results of the optimization of the hydraulic circuit from Loop 2. The best solutions highlighted are of particular interest with regard to the reference design. Both had a better penalty function value, but one had the same cost and footprint as the reference design, while the other had a lower cost.
Other Pareto frontier designs were not as interesting due to their higher cost and footprint. As mentioned in the previous section, Loop 3 was divided in two sub-optimizations. The optimization strategy for Loop 3 Opt. 1 was the same as for the other loops, with a robust step and an accurate one.
The strategy for Loop 3 Opt. 2 was a little different. The goal was to optimize the valve input currents only for the valve combinations present in the best valves list obtained from Opt. 1. We therefore decided to select a DOE sequence for the main workflow of Opt. 2 while a gradient-based optimizer (B-BFGS) was chosen for the nested optimizations related to comfort, handling, and traction. The DOE was created using an Incremental Space Filler, which ensured that all possible valve combinations were covered. An IF node was then used to check whether the current DOE design was in the list. If so, the optimization was allowed to continue, whereas the optimization would advance directly to the next design if not.

Conclusions

The development of the presented methodology in modeFRONTIER enabled not only the multi-objective optimization of the process, but also the study of the influence of some numerical parameters on the results of the simulation. This helped to increase our know-how and experience in this kind of activity. By dividing the workflow into three loops, it was possible to evaluate a larger number of designs which ensured the effectiveness and efficiency of the process.

The multi-objective approach used for each loop allowed both the Pareto frontier (i.e., the best trade-off set) to be identified and these best solutions to be compared to a reference design, which had been found manually prior to using modeFRONTIER.
As was to be expected, every loop produced one or more improvements compared to the reference solution. Finally, the modeFRONTIER workflow guaranteed complete automation of the entire analysis, maximizing the use of the hardware/software resources. Consequently, once the workflow was established, user involvement was only required to analyse the results when the optimization was complete, resulting in further cost savings. This study succeeded in integrating the entire design process of a new independent suspension axle for an off-highway vehicle using modeFRONTIER. The multi-disciplinary and multi-objective abilities enabled the vehicle’s kinematic and dynamic performance to be optimized by including the constraints from the mechanical design, the hydraulic system, and the cost in the simulation framework. Dana’s engineering expertise and modeFRONTIER technology resulted in an automated optimization process with the integration of several tools as Creo, MSC Adams, and Simcenter Amesim.

About Dana Incorporated

Dana is a leader in the design and manufacture of highly efficient propulsion and energy-management solutions for all mobility markets across the globe.
The company’s conventional and clean-energy solutions support nearly every vehicle manufacturer with drive and motion systems; electrodynamic technologies, including software and controls; and thermal, sealing, and digital solutions.

Based in Maumee, Ohio, USA, the company reported sales of $7.1 billion in 2020 with 38,000 associates in 33 countries across six continents. Founded in 1904, Dana was named one of “America’s Most Responsible Companies 2021” by Newsweek for its emphasis on sustainability and social responsibility.

The company is driven by a high-performance culture that focuses on its people, which has earned it global recognition as a top employer, including “World’s Best Employer” from Forbes magazine.

Learn more at dana.com.

Fig. 1 - Tractor with a suspended axle (highlighted as reference)
Fig. 2 - Dana’s suspended axle with a double wishbone architecture
Fig. 3 - Example of an MSC Adams 4-poster model
Fig. 10 - Loop 1 best solution clusters
Fig. 11 - Loop 2 best solutions

Find out more

CASE STUDY

Strategy to optimize the independent suspension system of an off-highway, agricultural tractor

The purpose of the case study was to implement a design methodology that used multi-disciplinary simulation and an automated process to analyse thousands of product configurations and highlight vehicle performance distributions in terms of handling, comfort, and cost. This approach ensures that the best solution is always selected.

mechanics modefrontier automotive optimization

NEWSROOM

Stay connected with us: news, analysis and trends from our experts.

Newsroom  

MEDIA CENTER

Scroll through our Media Center to view all the videos, video-tutorials and recorded webinars.

Media Center  

CASE STUDY

CFD study to optimize the cooling performance of a narrow specialty tractor

Numerical modelling reveals design strengths and weaknesses prior to prototype testing, saving time and money

In this technical article, a CFD study of various designs for four different specialty tractors: two brands of specialty tractors for vineyard configurations, and two brands of specialty tractors for orchard configurations, are described.

automotive ansys cfd