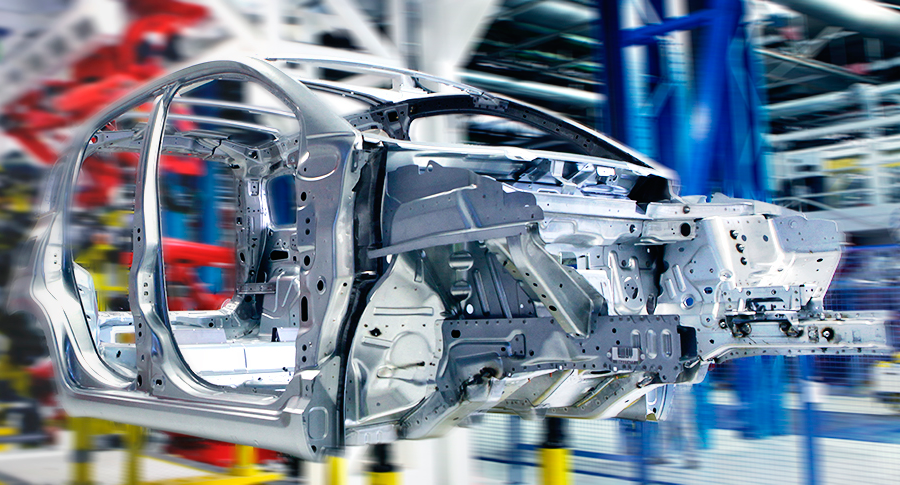
In the described scenario, and moreover for complex processes, several manufacturing system designs are generally feasible, depending on the constraints that are chosen by the Customer or by COMAU engineers. Depending on the objectives targeted for maximization or minimization, and on the constraints, some of the feasible designs will also be optimal in the Pareto sense, as they represent different but equally optimal alternatives on which a decision can be made.
Fig | EMEA region: production line Investment Vs Lifecycle costs
It is self-evident that, especially when designing systems for complex processes, the traditional Proposal Engineering approach cannot take into account all the possible combinations and feasible designs. In order to automate the Proposal Engineering manufacturing system design, an optimization workflow has been created using modeFRONTIER.
The workflow receives as input the production bill of process, the manufacturing system technological alternatives and constraints, together with the cost, reliability and the other necessary data. The workflow integrates different solvers, capable to generate and evaluate manufacturing system designs alternatives. Among these solver we can identify the line balancing and the performance evaluation solvers.
Overall, the workflow is capable of evaluating hundreds of different system designs in a few hours of computation. Each design that is generated by the modeFRONTIER workflow is characterized by its layout, type and number of stations, efficiency and throughput, equipment and lifecycle costs, etc. . Unfeasible designs, those that do not respect the given constraints (e.g. throughput or efficiency constraints), are automatically discarded. Feasible designs are collected and, as the optimization process continues, further refined.
Fig 7 | APAC region: production line Investment Vs Lifecycle costs
Some results of the optimization process are presented in figures. Each dot on the charts represents a different manufacturing system design. Fig. 6 presents the results for a manufacturing plant designed for a European country (EMEA region), when Investment costs for the desired production line are plotted against its Lifecycle costs computed over a 10 years period. These are competing objectives for the optimization. It can be noticed that, in this example, the feasible results tend to group together into three main clusters, corresponding to Highly manual, Medium automatic and Highly automatic designs. This effect is due to the provided technological constraints for the system. A Pareto front is provided, composed by different designs belonging to the three clusters: these Pareto optimal designs represent the set of optimum designs among whose a decision should be made. The distance between some of these designs, in terms of costs, is plotted in the chart: referring to Fig. 6 (EMEA region) the investment (CapEx) on a Highly automatic production line will exceed that of a Highly Manual by around 1.1 M€, but over 10 years it is expected that a Highly manual production line will cost 5.5 M€ more. Taking fig. 7 as a comparison, for the APAC region (e.g. China), the investment cost on a Highly automatic production line will also exceed that of a Highly Manual by around 1.1 M€, but over 10 years it is expected that an Highly manual production line will cost only 1.3 M€ more.
Fig 8 | EMEA Vs APAC production line designs
Fig. 8 presents the cost analysis for a similar production plant for the two EMEA and APAC regions together on the same chart. While it can be inferred, in a simplistic way, that Highly Automatic solutions are to be preferred in EMEA (due to the higher operative costs) with respect to Highly Manual solutions in APAC (lower operative costs), this analysis can be further enhanced by considering different scenarios for the evolution of the cost parameters over time, etc., in order to carry out what-if analysis of the investment. Figures 9a and 9b provide a 3D visual representation of two Highly Automatic and Highly Manual production system designs respectively.