Our Expertise | CIVIL ENGINEERING

Evaluating the safety performance of the Grand Ethiopian Renaissance Dam (GERD)
under seismic loads: A case study

Using the DCR time-history procedure to determine the behaviour of the dam’s 10.2M m3 of roller compacted concrete

Newsletter EnginSoft Year 14 n°4
By Alessandro Masciotta, Carlo Fontana, Angelo Fiorani | Studio Masciotta
Alberto Bezzi | Studio Pietrangeli
<h5>GERD Dam under construction</h5>
GERD Dam under construction

Abstract

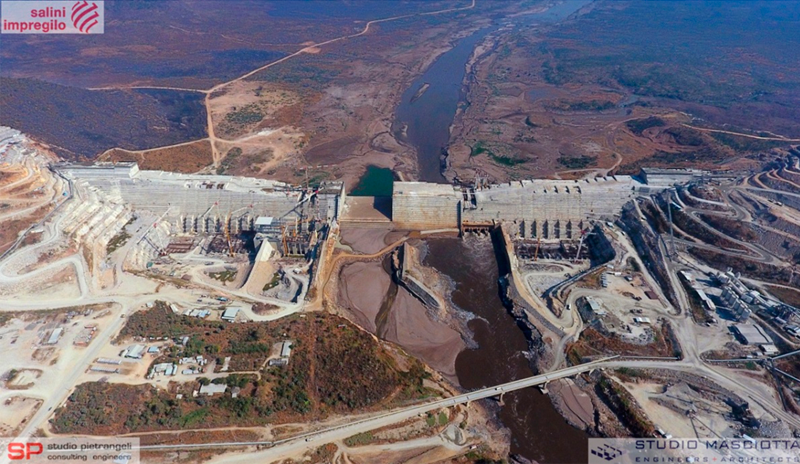
The Grand Ethiopian Renaissance Dam (GERD) is situated along the Blue Nile River. Located 500 km north west of the Ethiopian capital Addis Abeba, in the Benishangul-Gumaz region, the GERD will be the largest plant in Africa, representing an annual energy production capacity of 15.7 terrwatt hours and 6,140 MW of installed power. It represents an important project in the Ethiopian government’s commitment to the country’s future power needs and as such, its safety and security is paramount. In this technical case study, the engineers explain how they systematically and rationally applied the Demand-Capacity Ratio / Cumulative Inelastic Duration (DCR/CID) methodology, based on the US Army Corps of Engineers Code EM1110-2-6051, to estimate the behavior of the concrete structures under seismic loads, using a time-history analysis.

This approach can be used both to evaluate the safety of new or existing structures and to optimize construction costs during the design phase of a new dam. The case study also explains how they minimised the time necessary to complete the number of analyses required to ascertain the stability of the dam under extreme earthquake loads and how this was integrated into the design and cost planning phase.

This article presents a systematic and rational application of the Demand-Capacity Ratio / Cumulative Inelastic Duration (DCR/CID) methodology to estimate the behavior of concrete structures under seismic loads, using a time-history analysis. This rational approach, proposed by US Army Corps of Engineers (USACE) in its Code EM 1110-2-6051, can be used to evaluate the safety of new or existing structures and, moreover, to optimize the construction costs during the design phase.
This method was systematically implemented through the development of a dedicated calculation code in order to analyze the behavior under seismic loads of the Grand Ethiopian Renaissance Dam (GERD), along the Nile River. The dam, currently under construction, has a maximum height of 175 m, is 1780 m long and has a global Roller Compacted Concrete (RCC) volume of 10.2M m3. It is designed to store 74B m3 of reservoir serving a 6140 MW power plant.

The Grand Ethiopian Renaissance Dam (GERD) Project is located 500 km north west of the Ethiopian capital Addis Abeba, in the Benishangul–Gumaz region, along the Blue Nile River.
The Ethiopian Electric Power company (EEP) is the employer, Salini-Impregilo SpA is the engineering-procurement-construction (EPC) Contractor and Studio Pietrangeli Srl is the designer.
The plant, with its 6,140 MW of installed power and 15.7 TWh (terrawatt hours) of annual energy production, is one the most important projects committed to by the Ethiopian Government to meet the country’s present and future power requirements. The hydropower plant is currently under construction. Once completed, GERD will be the largest plant in Africa.

The rational method, described in the introduction, was practically applied thanks to a dedicated computation code that has been developed, tested, validated and systematically adopted by Studio Masciotta engineers.
The computation code consists of a series of Excel Macros and Straus 7 API (Application Programming Interface), aimed at extracting the results from the Finite Element Method (FEM) model and then computing the Demand-Capacity Ratio and the Cumulative Inelastic Duration of selected control points within the dam body.
The dam behavior analysis, considering the dam’s relevant length (about 2 kilometers) and great variety of geometries and foundation characteristics, required a series of fifteen transversal sections to be analyzed (representing sections of 130 meters in length), using a dedicated 2-D FEM model.

Every section was analyzed considering at least two possible and alternative geometries, in order to identify the optimum one.
Within every transversal section of the dam, an average number of about fifteen control points were fixed in order to assess the dynamic behavior of the dam under seismic events.
Every transversal section was analyzed considering six different earthquakes and four possible combinations of horizontal and vertical component signs for every earthquake.
Each hypothesized earthquake lasts 35 seconds and, assuming that an integration step is set every 0.005 seconds in the linear time-history analysis, seven thousand steps of integration characterize each earthquake combination.

The enquiry points were analyzed both in terms of vertical stresses (to be compared with lift joint tensile strength) and maximum principal stresses (to be compared with parent tensile strength), to have two relevant quantities to be examined at each control point.

It is therefore easy to infer that the quantity of the data to be processed to obtain the graphs of DCR and CID for the relevant sections is the result of: 15 x 2 x 15 x 6 x 4 x 7000 x 2 ≈ 151 million sets of data.
Assuming that an engineer could process a datum every two seconds, , it would take him/her 10,500 days at 8 working-hours per day, or more than 28 years to get the required result, with a clear possibility of the introduction of widespread human errors which would strong affect the reliability of the processed data. The idea of developing a dedicated software was therefore deemed not just a reasonable optimization of the engineers’ work, but rather an absolute necessity in order to comply with the times that had been agreed between the Designer Studio Pietrangeli Srl and the EPC Contractor Salini Impregilo.
The post-processing software is articulated in five sub-routines: Init, Eval DCR-CID, Graphs, Synth, and Print and it is based on the assumption that a linear time-history analysis of the dam sections has been correctly performed and that all result files are thus available for these specific purposes.

The Init routine is the interface with the FEM software Straus 7. It contains the calls to the Straus 7 API. The user can choose whether the API should fetch either the vertical stresses or the maximum principal ones and can select which plates to investigate. The engineering assessment is fundamental at this stage in order to limit the size of data that will be processed by the software. The routine cycles on the FEM model elements and then extracts the time-history of vertical/maximum principal stresses of the selected ones at saved times.

The Eval DCR-CID routine is the core of the calculation process performed by the software. It considers the time-history of the stresses extracted during the Init phase and compares them, step by step, with the Capacity value introduced by the user. It evaluates the Cumulative Inelastic Duration (CID) for Demand Capacity Ration (DCR) values, ranging from 1 to 2 (a DCR higher than 2 is not allowed).

The Graphs routine uses the data computed by the Eval DCR-CID routine to produce the DCR and CID graphs, in order to compare them with the limit line prescribed by USACE code, and to establish whether stability can be assessed using the simplified Linear Analysis (in cases of low to moderate damage) or whether it is necessary to perform a further Non Linear Analysis (in cases of significant damage).

Synth is the routine responsible only for chart sorting and formatting. It generates an Excel sheet for every selected element of the FEM model and matches the graphs with the related elements in the sheet. The charts are formatted to make them easy to read, print and present in a calculation Report.

Print fetches the graphs produced by the Synth routine and generates a pdf file for every graph, ready to be assembled in the Annexure of a Calculation Report of the Dam.

Results of DCR/CID analysis

GERD hydroelectric project, Main Dam general layout

The typical results of an DCR analysis performed by the software are reported in Fig. 3, presenting a fully verified element and another not verified, this latter also exceeding the acceptance limit.
The dam optimization process through the linear time-history procedure was essentially carried out during level 2 Design.
The dam was well dimensioned during basic and level 1 Design, using simplified pseudo static methods (Seismic Coefficient Method, Equivalent Lateral Force Method) and modal analyses with a Response Spectrum.
The analyzed geometries and sections were generally verified and the linear time-history procedure with the DCR-CID method was essentially used to optimize the sections. The systematic procedure allowed the designers to achieve the required values, typically 20% lower than the predicted ones, during level 1 Design by means of Modal Analysis with Response Spectra
Fifteen sections were systematically analyzed during Level 2 Design, adopting the simplified DCR approach and the relative calculation reports were produced. An approximate number of 9.000 DCR-CID synthesis graphs was generated by the software as described above.
In summary, fourteen sections were fully verified and their stability under extreme earthquake (SEE) loads was assessed through the linear time-history analyses.

Only the stability of the highest section of the dam, in correspondence to the Gorge, proved to have some critical points, since the DCR values were exceeded, adopting the tensile strength values fixed during Level One Design. Further Non Linear Analyses were performed, assuming the potential crack surfaces identified by means of the linear time-history analyses. Such activity confirmed the stability of the section and no permanent sliding displacements occurred.

Figure 3 - Examples of an element fully verified according to DCR method (left) and of an element not verified (right)
Figure 4 - Examples of section elements fully verified through DCR method – Time history of stress (left) and DCR-CID graph (right) for two different earthquakes
Figure 5 - Examples of section elements not verified through DCR method – Time history of stress (left) and DCR-CID graph (right) for two different earthquakes

Find out more

software

Straus7

Making finite element analysis easier

Straus7's fully-integrated visual environment - combined with a suite of powerful solvers - gives you unparalleled functionality in a single application. Construct models, run analyses and investigate results simultaneously using a seamless interface.

straus7

NEWSROOM

Stay connected with us: news, analysis and trends from our experts.

Newsroom  

MEDIA CENTER

Scroll through our Media Center to view all the videos, video-tutorials and recorded webinars.

Media Center  

CASE STUDY

Conduct fatigue checks directly in Ansys Mechanical using SDC Verifier

Template-based design automates future routine work, and automated documentation facilitates report generation

A lot of steel structures such as cranes, heavy machinery and other equipment subjected to repetitive loading is highly likely to develop cracks or failures because of the fatigue damage.

civil-engineering ansys sdc-verifier