CFD analysis for the evaluation of the air flow within a climate control unit
Considering the value of numerical analysis for new product design
Newsletter EnginSoft Year 12 n°1
By Ufficio Sviluppo Prodotti Climaveneta

Climaveneta SpA enlisted the support of EnginSoft to assess the possible advantages of using Computational Fluid Dynamics (CFD) analysis in its new product design process. The objective of the study was to create a virtual model of Climaveneta’s new ACU171 Expanded Close Control Unit and then match the numerical results with the experimental measures. Afterwards, the engineers tested some geometric modifications to optimize the distribution of the air flow velocity on the filter surface to improve the unit’s heat exchange properties. This brief technical article describes how the study was undertaken and the results obtained.
Read the article
CASE STUDY
The adoption of SBES has significantly increased in the last two decades, driven by advancements in computing technology and the rise of Industry 4.0, which promotes nine key enabling technologies, including engineering simulation and big data analytics. SBES is crucial for the integration and automation of production systems, improving flexibility, speed, and quality.
automotive construction energy cfd metal-process-simulation
CASE STUDY
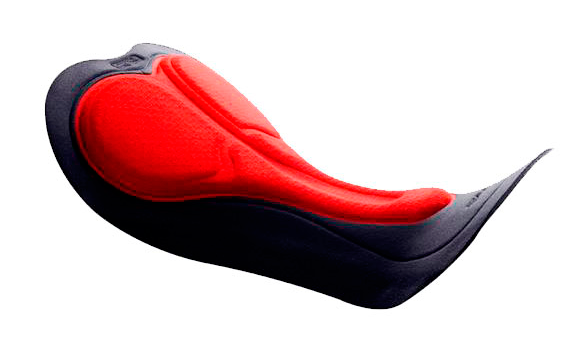
Sport equipment design is characterized by the fact that a fundamental part of a product success depends on the athlete’s feedback.
sports modefrontier ansys ls-dyna