The Self-Organizing Map (SOM) is an algorithm that projects high dimensional data onto a two-dimensional map. The projection preserves the topology of the data so that similar data items will be mapped to nearby locations on the map.</>
In the proposed approach, the SOM has been used to analyze local correlations between the two objectives (target and heat loss index) exploiting the results of the previous NSGA-II optimization.
In fact, detecting such local correlations allows to identify a reduced input parameter range that includes the most promising designs for the desired output values. In this way, a subsequent search campaign could be set up within this reduced input parameter space.
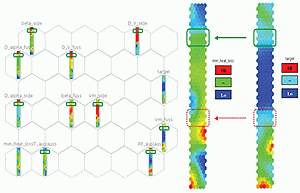
Figure 5 displays the component charts relative to the built SOM. The grid on the left collects the whole set of SOM component charts, and in particular also the design parameters. At the right, the component charts of target and heat loss index are shown in detail. In such conventional charts, each hexagon is a “box” containing a group of similar designs, previously computed by the CFD model or interpolated by the SOM’s unsupervised neural network. They are “similar” with respect to the complete vector of parameters and output values, which define them in the n-dimensional space. Adjacent hexagons mean similar groups. A corresponding hexagon in 2 different parameter’s maps (i.e. an input and an output one) represents the same “box”, hence including the same set of designs. The hexagon’s color, conversely, depends on the map itself: it represents the averaged value of such parameter within the selected group of designs included in the “box”. Comparing the color pattern of a corresponding set of hexagons in two different maps, means looking for a set of designs with a certain common trend of parameters (local correlation between the parameters).
Therefore, local correlations between a couple of parameters can be detected comparing their SOM maps and searching for zones where hexagons have similar color patterns. Since the goal here is to check whether a local correlation exists between the heat loss and a target value slightly less than 0.025, their SOM charts are compared in Figure 5 (right). A local correlation of the two outputs, where target is a bit lower than 0.025 (pale blue color), exists in the SOM units underlined with a solid line in Figure 5 top-right, as the similar uniform color pattern testifies. As an example, no local correlation can be assessed for the design groups in the dotted line square, (Figure 5 bottom-right): the corresponding target and heat loss color patterns are not similar.
After selecting the hexagons included in the solid line box in the right side of Fig.5, a re-definition of the design space has been achieved by restricting the design parameter to the range defined by the designs included in such SOM units (represented by the range of colors of the corresponding hexagons in the left side of Fig.5, the green-framed ones). Each one of the input variable ranges has been reduced sensibly, in most of the cases more than halved, with an average reduction of 43%: this means that the size of the search domain is strongly reduced and focused only to the most promising zones with regards to the designer’s requirements. This leads to a much faster second step optimization. A Reduced Factorial DOE sequence of 16 configurations has been set up, in order to add uniformly few new points in such restricted input parameter space. All the previously simulated designs belonging to the selected SOM units, and hence falling within the restricted range, were added to the Reduced Factorial DOE result database. Then a RSM, namely a set of Radial Basis Functions (RBF), were trained with that data, in order to model each of the problem’s goals. Such RSMs have then been used to interpolate new configurations, disconnecting the link between the optimizer and the computationally expensive CFD calculations. In fact, upon such RSMs, a new extensive NSGA-II optimization has been performed in order to search for optimum(s) with reduced heat loss values, respecting the constraint target. In this way, approximately 1800 points were estimated in a few seconds. The results have then been filtered according to the dominance criteria, and the most promising design candidates were selected to be validated with new CFD simulations. This choice was done taking into account not only the estimated values of the goals, but also the distance of such points with respect to the training set points in the 10-dimensional parameter space. Three designs have been selected and subsequently validated with new CFD simulations.